 |
|

|
 |
|

|
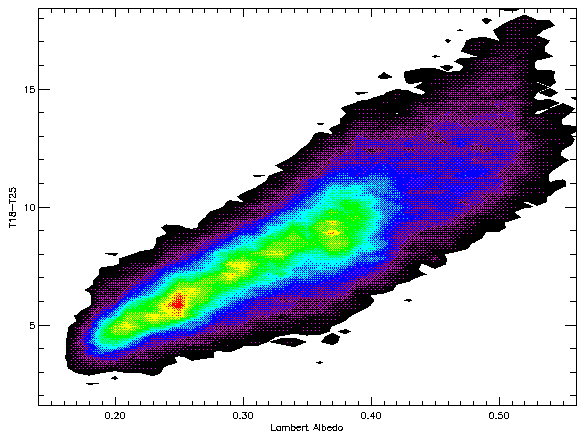 Figure 3aAlbedo vs T18-T25 for Ls=218°
-222°. This plot is a 2-dimensional histogram showing the correlation
between T18 -T25 and albedo. If one assumes that the dust abundance in
the CO2 is relatively constant, then this correlation is due to
variations in the CO2 grain sizes, where dark CO2 is coarse-grained
(or ice) and bright CO2 is finer-grained.
 Questions should be addressed to Tim Titus